Examine and edit HTML
You can examine and edit the page’s HTML in the HTML pane.
Navigating the HTML
HTML breadcrumbs
At the bottom on the HTML pane is a breadcrumbs toolbar. This shows the complete hierarchy through the document for the branch containing the selected element:
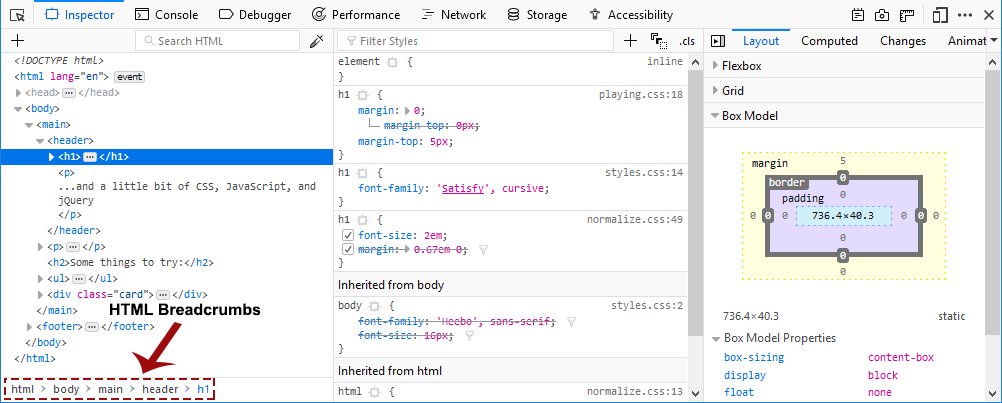
Hovering over a breadcrumb highlights that element in the page.
The breadcrumbs bar has its own keyboard shortcuts.
Searching
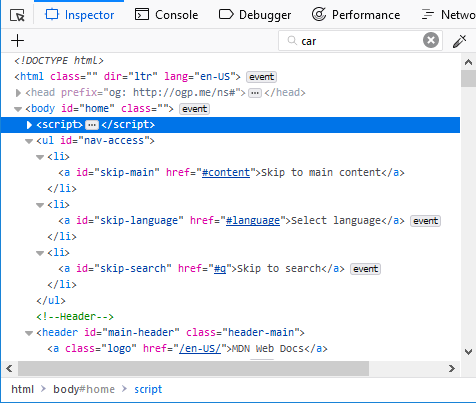
The Page Inspector’s search box matches all markup in the current document and in any frames.
To start searching the markup, click in the search box to expand it or press Ctrl + F , or Cmd + F on a Mac. There are three types of searches that are performed automatically depending on what you enter, a full text search, a CSS selector search, and an XPath search.
Full text search
The full text search will always be executed, independently of what you enter. That allows you to find CSS selectors and XPath expressions occurring within the text.
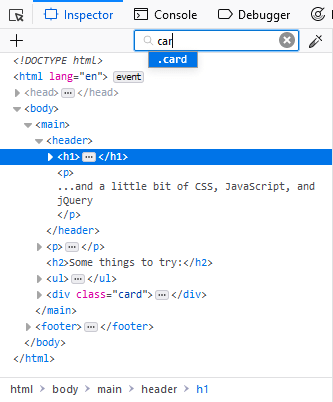
CSS selector search
You can search elements by entering a CSS selector
As you type, an autocomplete popup shows any class or ID attributes that match the current search term:
Press Up and Down to cycle through suggestions, Tab to choose the current suggestion, then Enter to select the first node with that attribute.
To cycle through matches, press Enter. You can cycle backwards through matches using Shift + Enter.
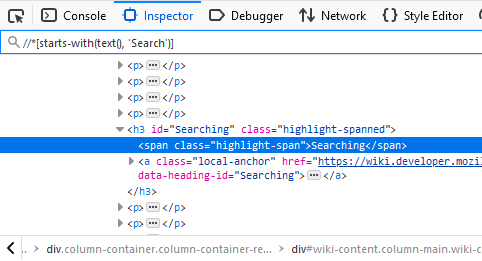
XPath search
It is also possible to search via XPaths. This allows you to search for specific elements without the conflict of matching words within the text. For example, //a matches all a elements but not the letter “a” within the text content. Furthermore it allows for some more advanced searches like finding elements that start with a specific text, for example.
HTML tree
The rest of the pane shows you the page’s HTML as a tree (this UI is also called the Markup View). Just to the left of each node is an arrow: click the arrow to expand the node. If you hold the Alt key while clicking the arrow, it expands the node and all the nodes underneath it.
Moving the mouse over a node in the tree highlights that element in the page.
Nodes that are not visible are shown faded/desaturated. This can happen for different reasons such as using display: none or that the element doesn’t have any dimensions.
There is an ellipsis shown between the opening and closing tag of an element when the node is collapsed if it has larger contents. Now children are indicated in the tree with this icon: {{ image1 }}
Markers (“badges”) are displayed to the right of some nodes. The table below explains the meaning of each badge:
|
The element has one or several event listeners attached to it. Clicking the marker opens a tooltip listing the event listeners and allows you for each listener to switch to the line of JavaScript code in the Debugger where the listener is defined. |
|
The element is a scroll container, i.e. it has either |
|
The element is causing scrollable overflow in a scroll container (either the current node or a parent node—the affected nodewill display the |
|
The element is a grid container, i.e. it has display: grid applied to it. Clicking the marker enables the grid highlighter. |
|
The element is a flex container, i.e. it has display: flex applied to it. Clicking the marker enables the flexbox highlighter. |
|
The element is an inline grid container, i.e. it has display: inline-grid or |
|
The element is an inline flex container, i.e. it has display: inline-flex or |
|
The element is a custom element. Clicking the marker switches to the line of JavaScript code in the Debugger where the custom element got defined. |
Note
There are some useful keyboard shortcuts that can be used in the HTML tree — see the HTML pane keyboard shortcuts list.
::before and ::after
You can inspect pseudo-elements added using ::before and ::after
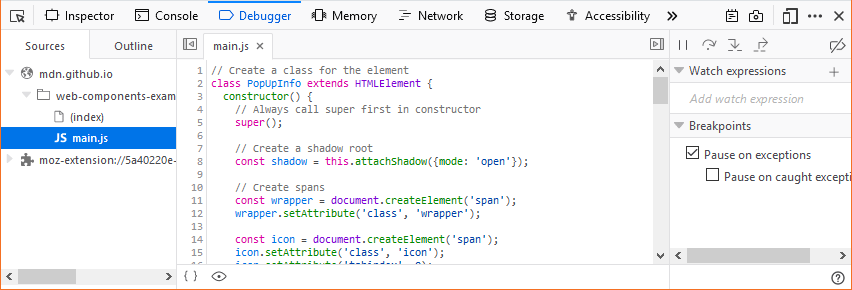
Custom element definition
When you open the Inspector on a page that includes custom elements, you can view the class definition for the custom element in the Debugger:
Inspect the element
Click on the word
custom
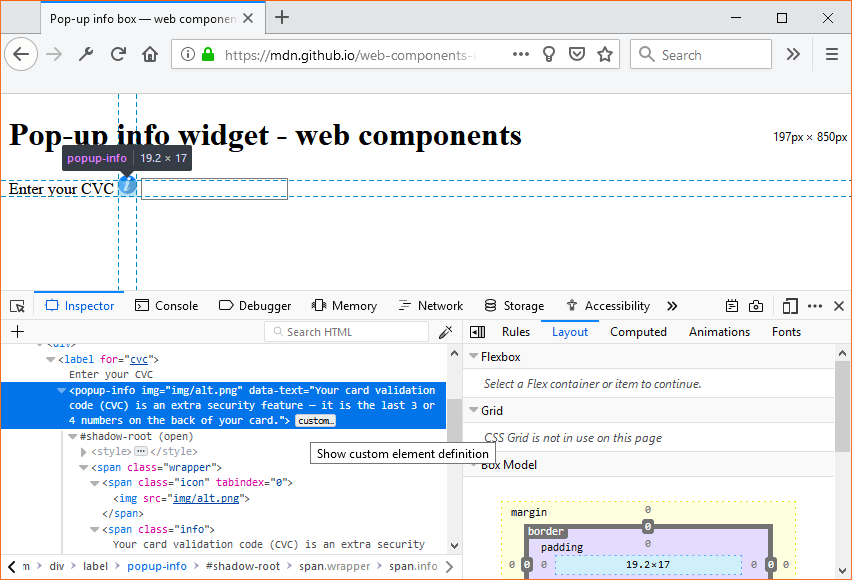
The source for the element’s class will be displayed in the Debugger.
Whitespace-only text nodes
Web developers don’t write all their code in just one line of text. They use white space such as spaces, returns, or tabs between their HTML elements because it makes markup more readable.
Usually this white space seems to have no effect and no visual output, but in fact, when a browser parses HTML it will automatically generate anonymous text nodes for elements not contained in a node. This includes white space (which is after all a type of text).
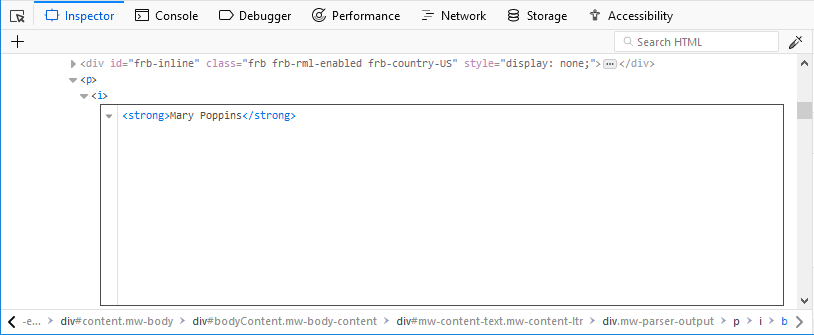
If these auto generated text nodes are inline level, browsers will give them a non-zero width and height. Then you will find strange gaps between elements, even if you haven’t set any margin or padding on them.
The Inspector displays these whitespace nodes, so you can see where the gaps in your markup come from. Whitespace nodes are represented with a dot: {{ image2 }} and you get an explanatory tooltip when you hover over them:
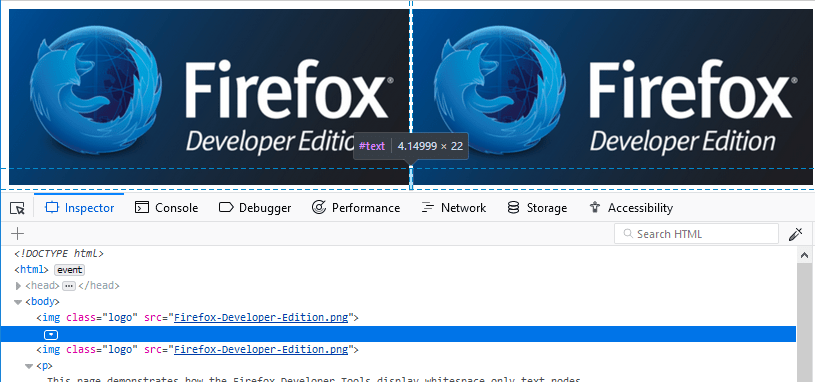
To see this in action, see the demo at https://firefox-devtools.github.io/devtools-examples/whitespace-only-demo/index.html.
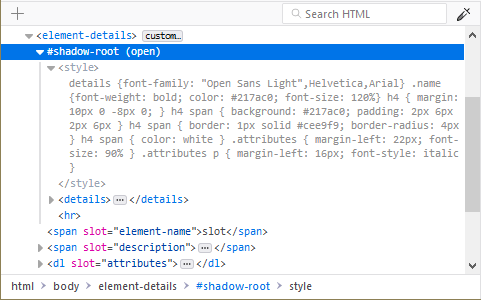
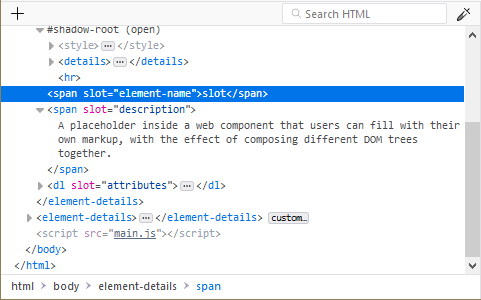
Shadow roots
Any shadow roots present in the DOM are exposed in the HTML page in the same manner as the regular DOM. The shadow root is signified by a node named #shadow-root — you can click its expansion arrow to see the full contents of the shadow DOM, and then manipulate the contained nodes in a similar way to other part of the page’s DOM (although with a limited featureset — you can’t, for example, drag and drop or delete shadow DOM nodes).
If a shadow DOM contains a “slotted” element (an element with a slot attribute after it has been inserted inside a slot element — see Adding flexibility with slots for an explanation of how these are used), the “slotted” element will be shown inside its corresponding slot element, with a “reveal” link alongside it. Clicking the “reveal” link will highlight the element with the slot attribute as it exists outside the shadow DOM
This is very useful when you’ve got a <slot> element and you can’t find the source of its content.
Editing HTML
You can edit the HTML — tags, attributes, and content — directly in the HTML pane: double-click the text you want to edit, change it, and press Enter to see the changes reflected immediately.
To edit an element’s outerHTML, activate the element’s popup menu and select “Edit As HTML”. You’ll see a text box in the HTML pane:
You can add any HTML in here: changing the element’s tag, changing existing elements, or adding new ones. Once you click outside the box, the changes are applied to the page.
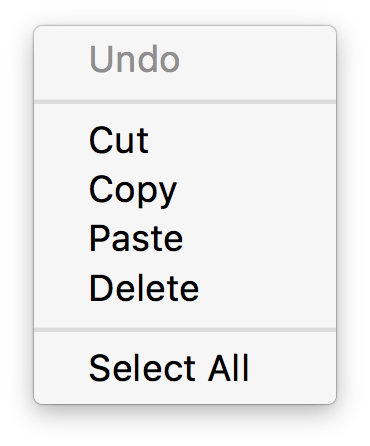
When you’re editing HTML, the context menu you’ll see is the normal one for working with editable text:
Copy and paste
You can use the popup menu to copy nodes in the HTML tree and paste them into the desired location.
Drag and drop
You can reorganize the HTML content of a page by moving nodes in the HTML tree. Just click and hold on any element and drag it up or down in the tree. When you release the mouse button, the element will be inserted at the corresponding position:
You can cancel the drag and drop by pressing the Esc key.
Inserting new nodes
There’s a “+” icon at the top of the markup view:
Click this icon to insert an empty <div> element into the document as the last child of the currently selected element. You can then edit the new node’s content and styling just as you would any other node in the document.
You can access the same functionality using the “Create New Node” popup menu item.
Note that this button is disabled if the selected element’s type is such that adding a last-child would have no effect (for example, if it is an html or iframe element). However, it is enabled in places where it is not valid to insert a div, such as style or link. In these cases the element is added as text.